Heatmap

Home > Heatmap

Heatmaps : Visualize Engagement and Optimize Layout

Where users are clicking, scrolling, and hovering on your site or app, giving you a clear visual representation of user engagement.
Highlight Key Interactions

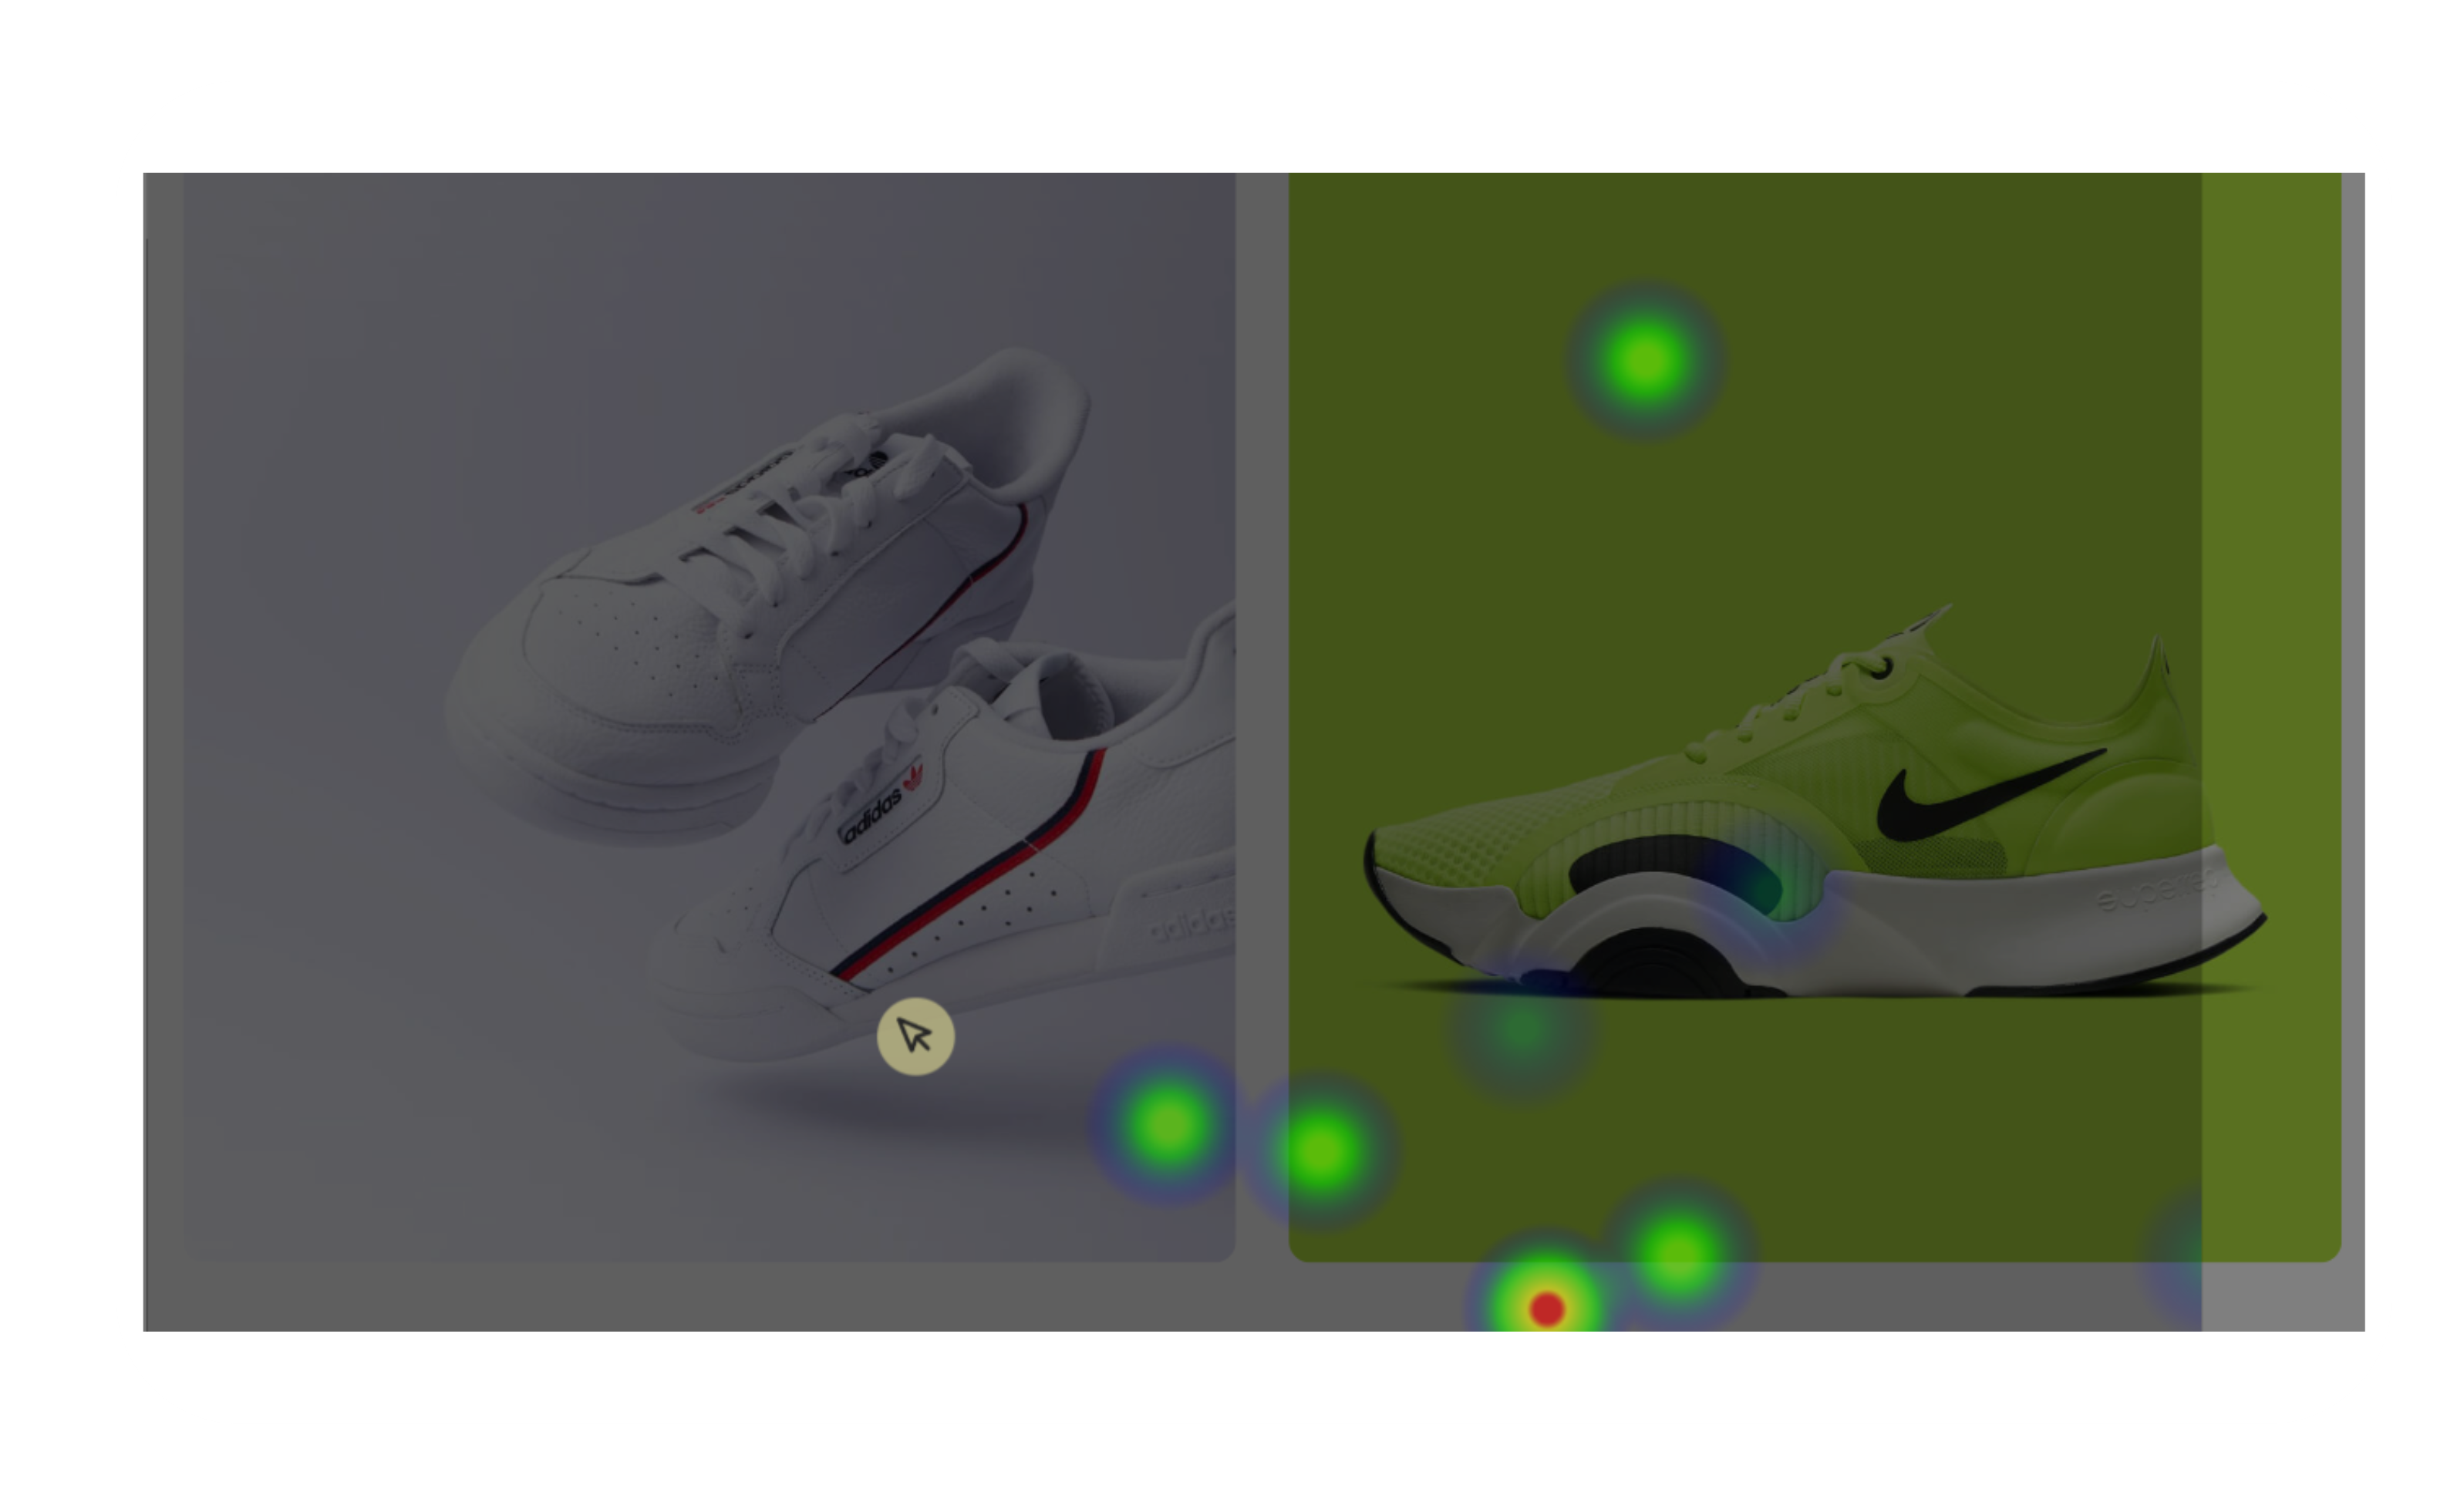
Gain a clear understanding of customer behavior by tracking clicks, scrolls, and hovers across your platform. See which product images, categories, or promotional banners attract the most attention to identify what resonates with your audience.

Optimize Layout Effectively

Use this data to strategically redesign your layout, ensuring critical elements like "Add to Cart" buttons, discount banners, or product filters are placed where they drive the most engagement and sales.

Boost Content Engagement

Analyze how users interact with your content, from product descriptions to category filters. Use insights to refine your messaging and visuals, keeping shoppers engaged longer and guiding them toward purchase decisions.
Heatmaps Based on All Sessions

Our heatmaps are generated from all recorded sessions, ensuring the data is comprehensive and accurately reflects user behavior across your site.

Heatmaps drawn from 100% of sessions offer a more accurate and reliable view of user engagement, leading to smarter design decisions and better optimization of your site.

70%

Customers leave if the size guide or shipping info isn’t visible early on

28%

Users click on non-interactive elements

42%

Users abandon their cart after viewing the product details

Solve Engagement Challenges

Low Engagement Zones

Surface areas on your site or app where user interaction is minimal and refine your design to boost activity.

Clarity in User Behavior

Spot patterns like over-clicking or confusion in navigation to address design flaws directly.

Optimized Content Placement

Use scroll, click, and hover data to ensure key elements like CTAs and important content are positioned effectively.

3 Essential Views to Understand User Engagement.

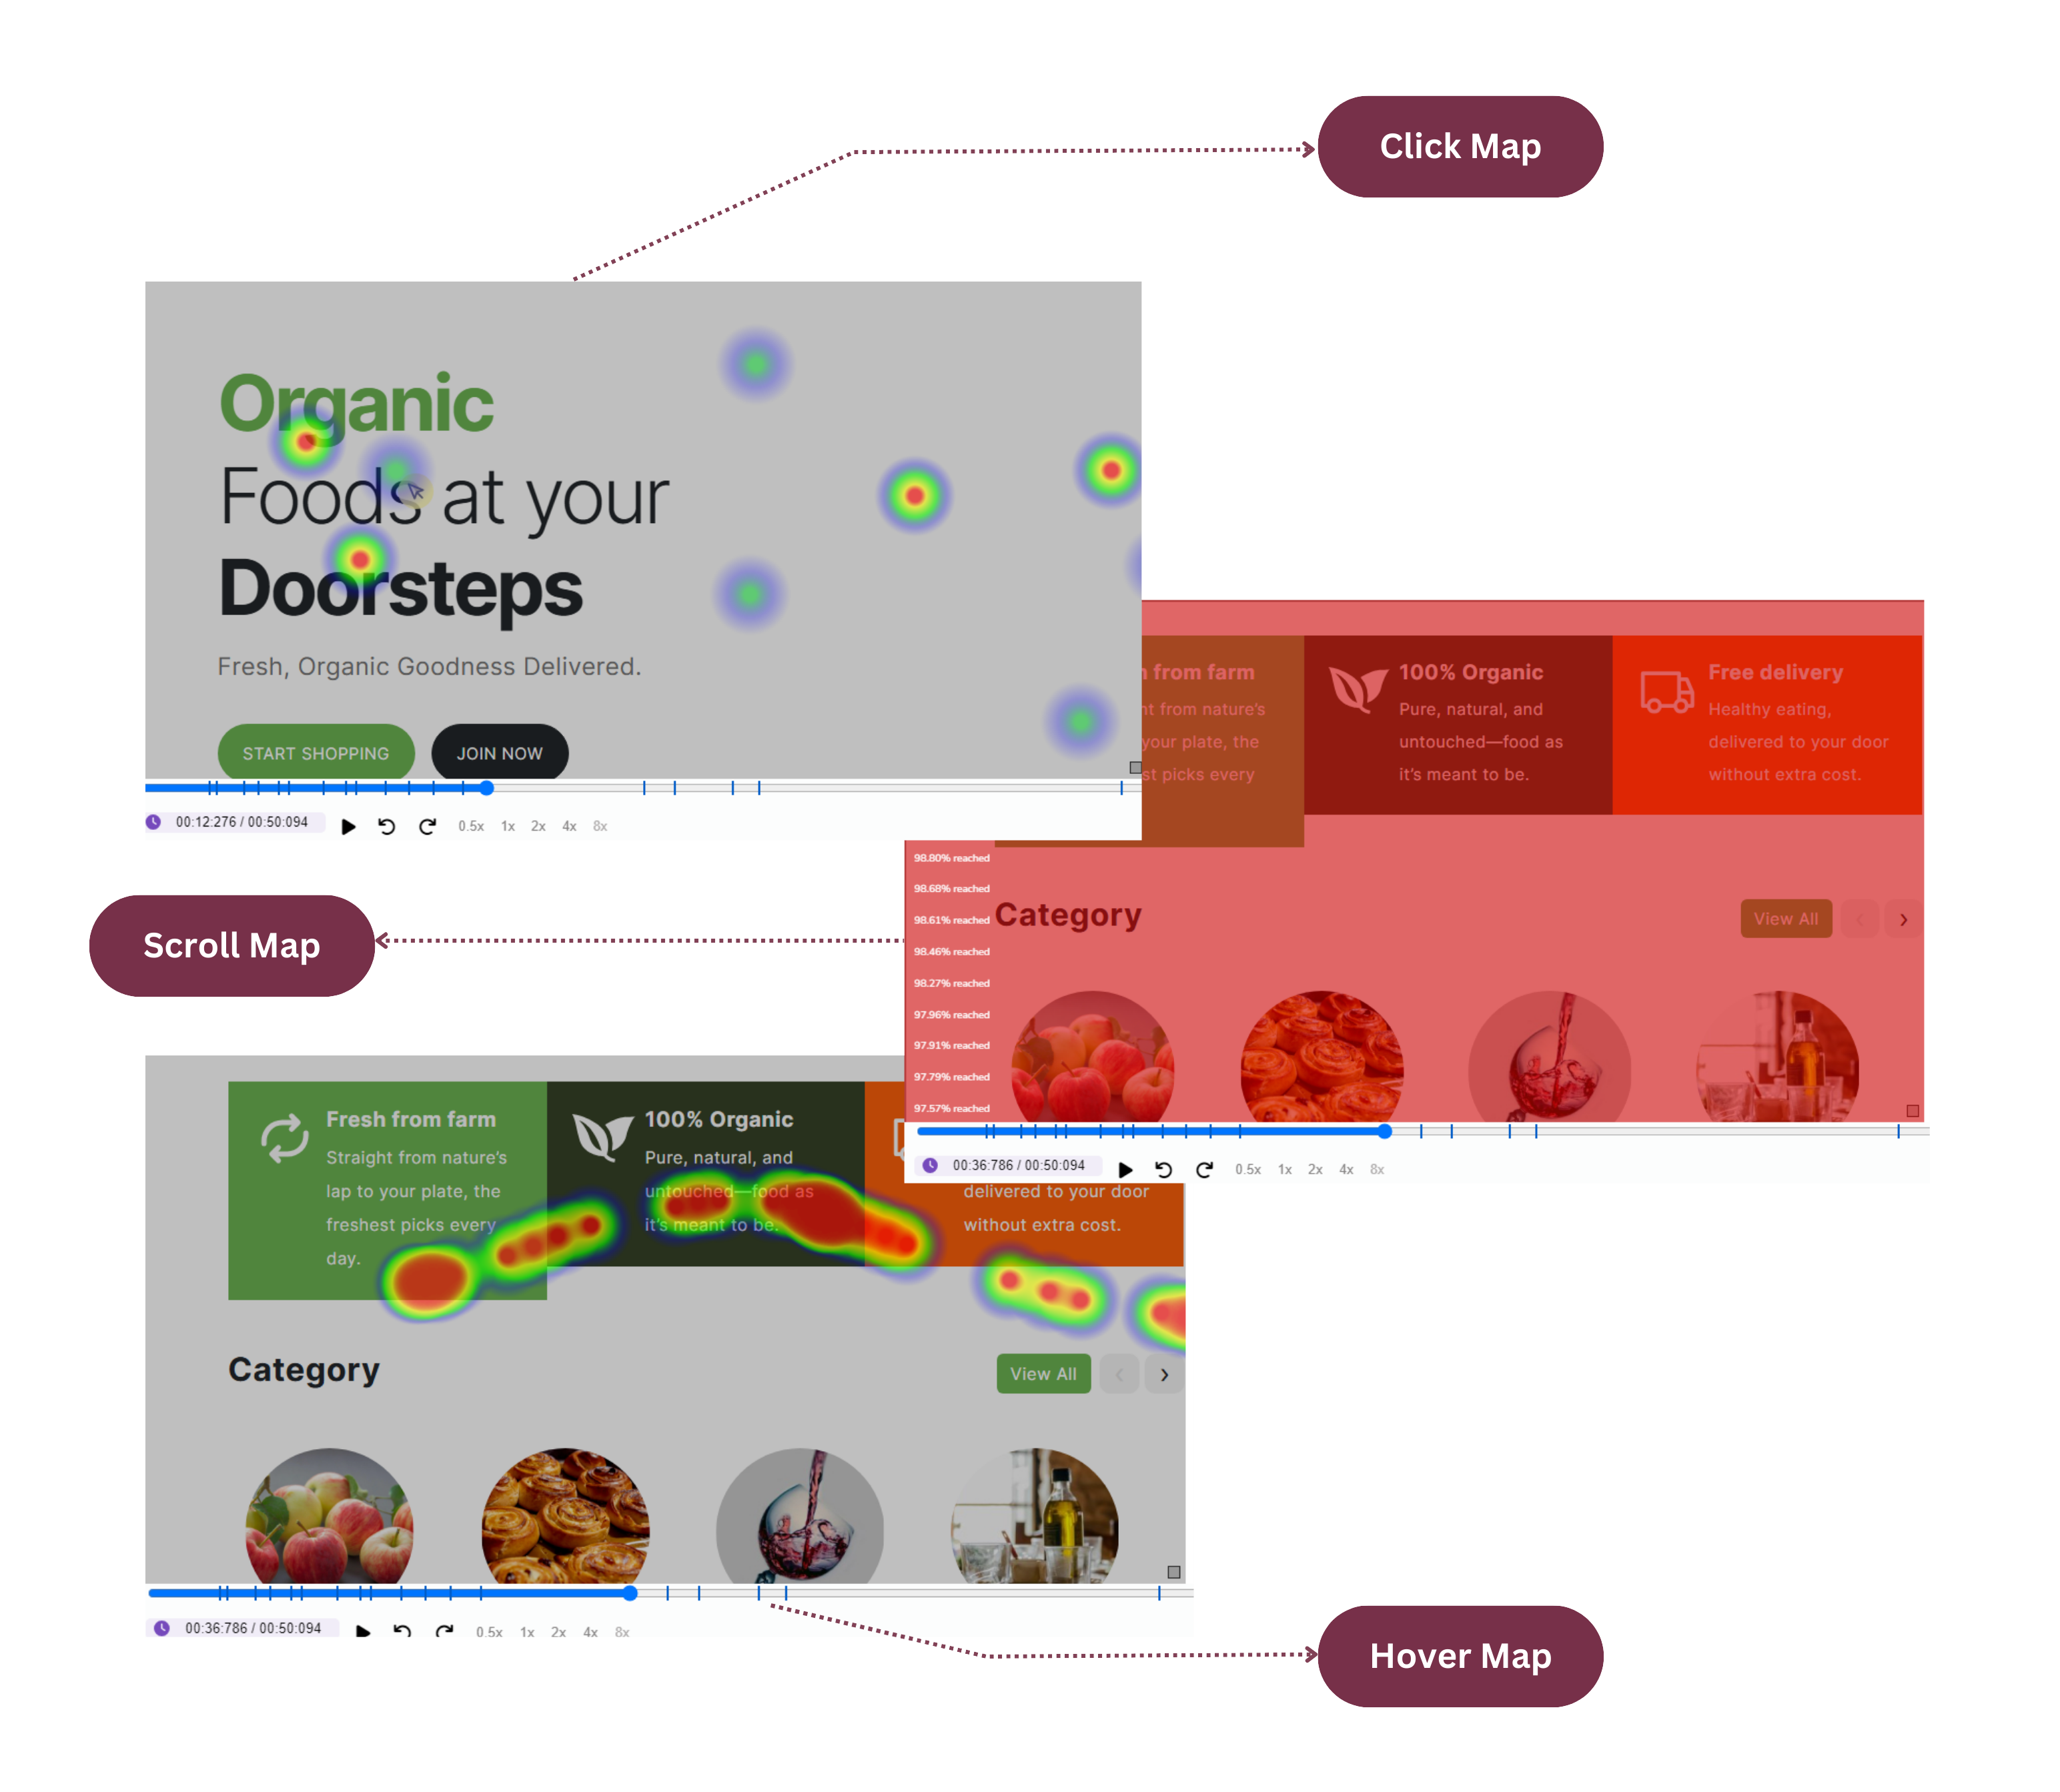
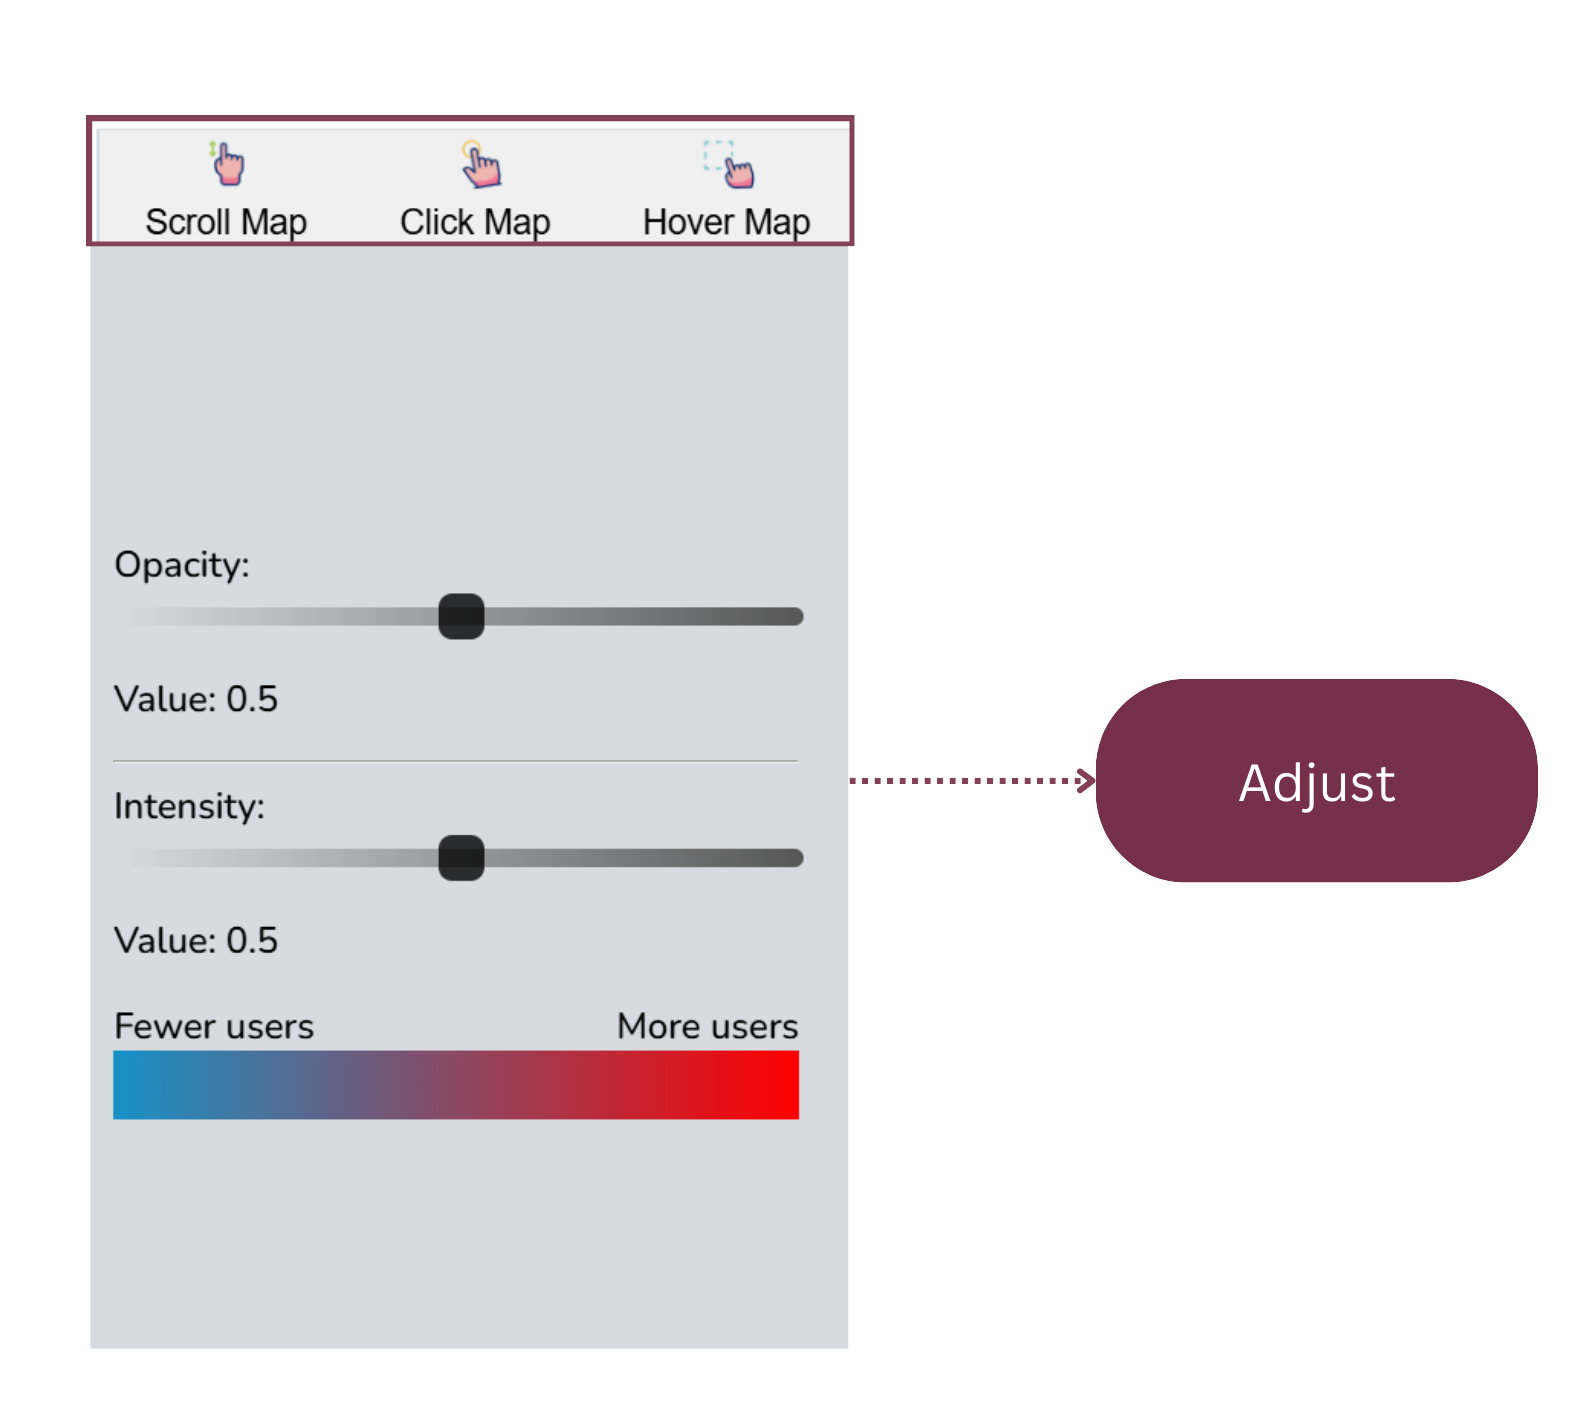
Click Maps show where users click, highlighting high-interest areas and uncovering potential confusion or missed interactions.

Scroll Maps track how far users scroll, identifying content drop-off points to ensure critical information is placed where it’s seen.

Hover Maps reveal where users pause their cursors, giving insights into areas drawing attention, even without clicks.

Together, these heatmaps provide a comprehensive view of user behavior, empowering you to optimize layout, content, and navigation effectively.

Explore more